Every business owner wants their business to be profitable. But how do you define a good profit? For instance, if your business is making a 6% net profit, you might wonder if it’s better to just put your money in a Bank Fixed Deposit (FD) that earns 7.5% interest per year.
A good profit is often gauged by the Return on Equity (RoE). A RoE between 15% and 20% is usually seen as a strong return on the capital invested by a business owner.
This is where DuPont analysis comes into play. It challenges the idea that RoE alone is enough to measure success. Du Pont analysis breaks down RoE into three parts, providing a deeper look into what’s driving your business’s profitability.
What is DuPont Analysis?
Financial analysis is key to determining a company’s performance. DuPont analysis is a great tool that helps break down a company’s main profit measure, ROE, to give a clearer view of its financial state.
DuPont analysis helps you understand exactly how a company makes its money and spots any weak spots by breaking down its main money-making metric, ROE, into simpler parts. It gives a fuller picture than just looking at ROE alone.
Components of DuPont Analysis
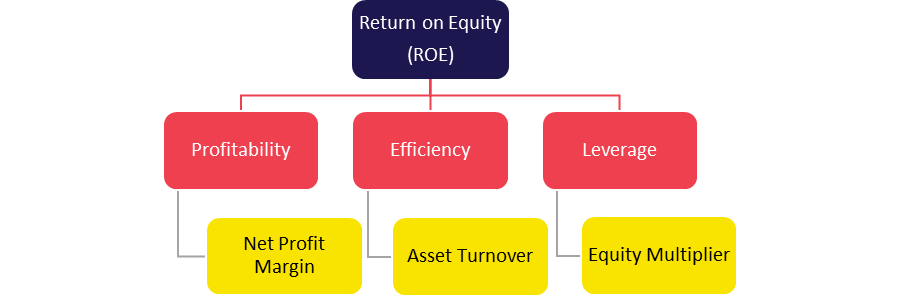
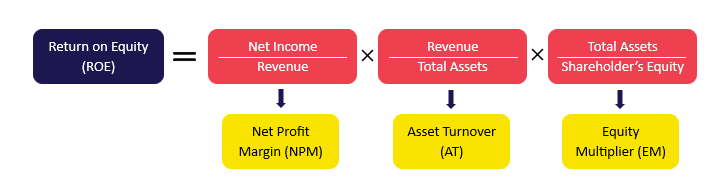
DuPont analysis provides a structured approach to evaluating a company’s ROE. Rather than treating ROE as a singular metric. DuPont analysis breaks it down into three key components: Net Profit Margin (NPM), Asset Turnover (AT), and Equity Multiplier (EM)
Now, let’s delve into each component of DuPont Analysis:
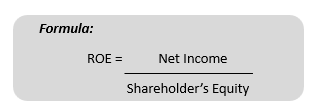
Return on Equity (ROE): Return on Equity (ROE) is a financial metric that measures the profitability of a company to its shareholders’ equity. It is a key indicator of how well a company is utilizing its equity to generate profits
Formula:
Interpretation:
ROE shows how efficiently a company is using its equity to generate profits. For example, an ROE of 15% means that the company is generating a 15% return on the equity invested by shareholders.
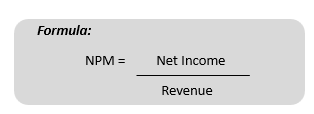
Net Profit Margin (NPM): NPM measures the percentage of profit relative to total revenue. It reveals how well a company controls its costs and converts sales into profit.
Formula:
Interpretation:
A higher NPM indicates efficient cost management and a greater ability to retain earnings after covering expenses.
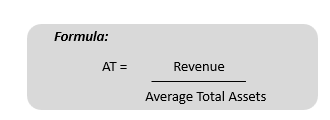
Asset Turnover (AT): Efficiency takes center stage with this component. AT measures how effectively a company utilizes its assets to generate revenue. It is calculated by dividing total revenue by average total assets.
Formula:
Interpretation:
Asset Turnover (AT) measures how well a business uses its assets to make and sell products. A higher AT means the business is using its assets well to create sales, showing it operates efficiently.
Equity Multiplier (EM): Also known as financial leverage, EM assesses the extent to which a company employs debt to finance its assets. It is calculated by dividing the average total assets by the average shareholders’ equity. It highlights the extent to which a company relies on debt to fund its operations.
Formula:
Interpretation:
A higher equity multiplier indicates a higher level of financial leverage, implying that a larger portion of the company’s assets is financed by debt rather than equity.
Calculation of ROE using DuPont Analysis:
Let’s go through a hypothetical example of DuPont Analysis to illustrate how it works.
Company ABC Financials:
Net Income: ₹15,00,000
Total Revenue: ₹50,00,000
Average Total Assets: ₹1,00,00,000
Shareholders’ Equity: ₹40,00,000
DuPont Analysis Calculation:
NPM = Net Income = 15,00,000 = 30%
Revenue 50,00,000
AT = Revenue = 50,00,000 = 0.5
Total Assets 1,00,00,000
EM = Total Assets = 1,00,00,000 = 2.5
Shareholder’s Equity 40,00,000
Now, we use these components to calculate ROE using the DuPont formula:
ROE = NPM × AT × EM
ROE = 30% × 0.5 × 2.5 = 37.5%
Conclusion
Managers can use DuPont analysis to figure out how to boost their company’s profits, work more efficiently, or better manage their money. This analysis shows them exactly what to focus on to make their company do better financially.
When companies in the same industry are compared using DuPont analysis, it helps them see how they stack up against each other. This comparison is more detailed because different industries might care more about certain parts of the DuPont analysis than others.
Think of DuPont analysis as a super-detailed financial magnifying glass. It looks closely at how a company makes money, uses its assets, and manages its debts. This helps people running the company, or those interested in its success, to make smart choices, plan better for the future, and handle their finances in a complex business world. DuPont analysis is a crucial tool for companies aiming to do well over time.
If your business is growing but financial clarity is still missing, you don’t need more reports — you need better insights. CFO Services LLP helps you understand what’s really driving your profitability and where to improve. Get in touch today and take control of your financial performance.
FAQs for DuPont Analysis
1. What is DuPont Analysis in simple terms?
DuPont Analysis is a financial method that breaks down Return on Equity (ROE) into three parts, profitability, efficiency, and leverage, to understand what drives a company’s performance.
2. What are the three components of DuPont Analysis?
The three components of DuPont Analysis are:
-
Net Profit Margin (NPM)
-
Asset Turnover (AT)
-
Equity Multiplier (EM)
These together explain how a company generates its Return on Equity.
3. What is the formula for DuPont Analysis?
The DuPont formula is:
ROE = Net Profit Margin × Asset Turnover × Equity Multiplier
This helps identify whether profitability, efficiency, or leverage is impacting returns.
4. Why is DuPont Analysis important for businesses?
DuPont Analysis helps businesses understand the real drivers of profitability instead of relying only on ROE. It highlights inefficiencies, cost issues, and financial risks.
5. What is a good Return on Equity (ROE)?
A Return on Equity (ROE) between 15% to 20% is generally considered strong, indicating efficient use of shareholders’ funds.
6. How does DuPont Analysis improve decision-making?
It helps business owners identify whether they need to:
-
Improve margins
-
Use assets more efficiently
-
Adjust their capital structure
This leads to better financial and strategic decisions.
7. Can DuPont Analysis be used to compare companies?
Yes, DuPont Analysis is very useful for comparing companies within the same industry, as it breaks down performance into detailed components.
8. What does a high Equity Multiplier indicate?
A high Equity Multiplier indicates higher financial leverage, meaning the company relies more on debt to finance its assets, which increases both returns and risk.